matplotlib函数用法
import matplotlib.pyplot as plt
matplotlib图像显示配置
- plt.rcParams[‘参数’]
| 参数 | 用法 | 实例 |
|---|---|---|
| savefig.dpi | 图片像素 | plt.rcParams['savefig.dpi'] = 300 |
| figure.dpi | 分辨率 | plt.rcParams['figure.dpi'] = 300 |
| figure.fugsize | 设置figure_size尺寸 | plt.rcParams['figure_size'] = (8.0, 4.0) |
| image.interpolation | 设置interpolation style | plt.rcParams['image.interpolation'] = 'nearst' |
| image.cmap | 设置颜色style | plt.rcParams['image.cmap'] = 'gray' |
| font.serif | 设置正文字体 | plt.reParams['font.serif'] = ['SimHei'] |
| font.sans-serif | 设置表格内字体 | plt.rcParams['font.sans-serif'] = ['SimHei'] |
Serif和Sans-serif字体的区别 : 网页链接
- 字体参照表
| 字体 | 参数 |
|---|---|
| 黑体 | SimHei |
| 微软雅黑 | Microsoft YaHei |
| 微软正黑体 | Microsoft JhengHei |
| 新宋体 | NSimSun |
| 新细明体 | PMingLiU |
| 细明体 | MingLiU |
| 标楷体 | DFKai-SB |
| 仿宋 | FangSong |
| 楷体 | KaiTi |
| 仿宋_GB2312 | FangSong_GB2312 |
| 楷体_GB2312 | KaiTi_GB2312 |
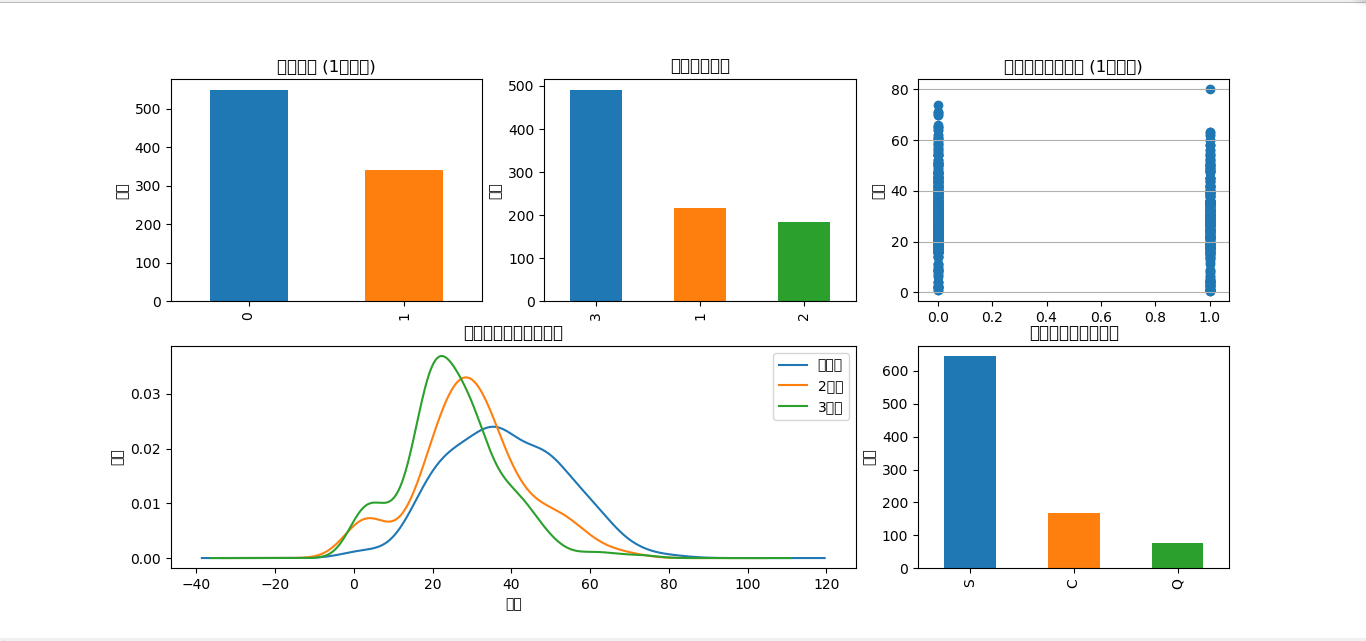
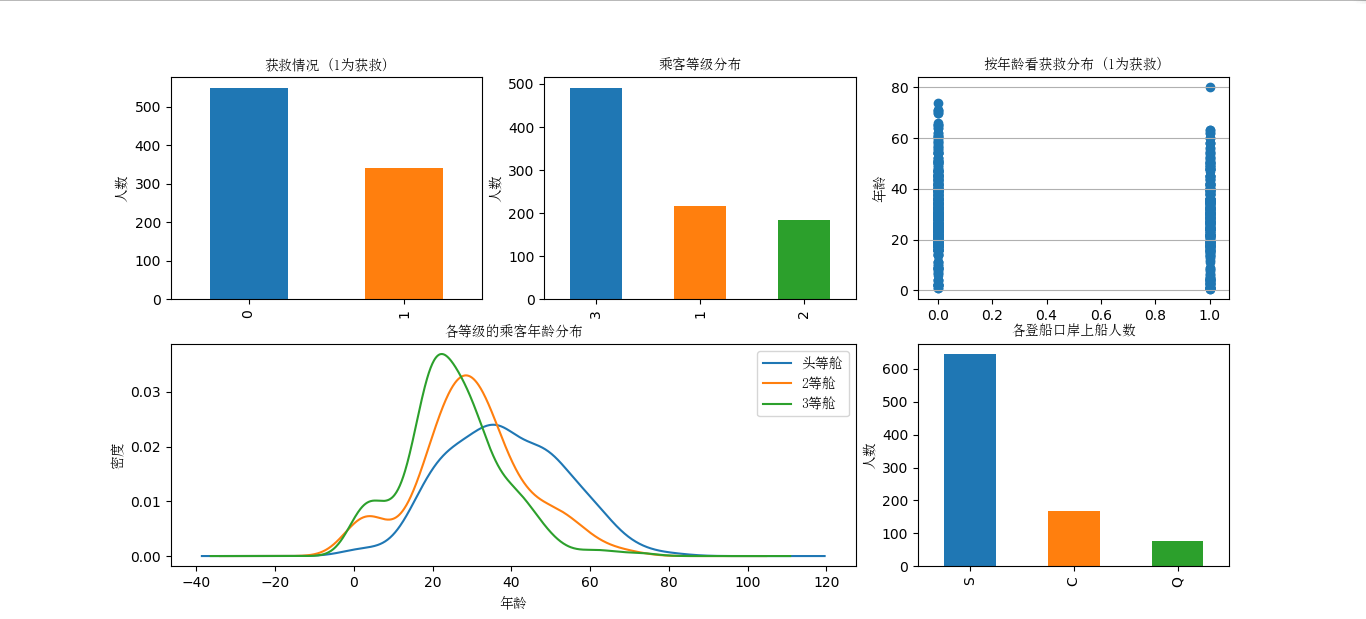
Matplotlib画图出现中文乱码的问题
plt.legend()——用于显示图例
legend()的一个用法:
1 | import matplotlib.pyplot as plt |
- loc参数表
| 参数 | 对应数字 |
|---|---|
| ‘best’ | 0 |
| ‘upper right’ | 1 |
| ‘upper left’ | 2 |
| ‘lower left’ | 3 |
| ‘lower right’ | 4 |
| ‘right’ | 5 |
| ‘center left’ | 6 |
| ‘center right’ | 7 |
| ‘lower center’ | 8 |
| ‘upper center’ | 9 |
| ‘center’ | 10 |

