plt.figure()函数绘图使用方法

1. figure语法及操作

1.1. figure语法说明
1
2
3
4
5
6
7
8
9
10
figure(num=None, figsize=None, dpi=None, facecolor=None, edgecolor=None, frameon=True)

"""
num : 图像编号或名称,数字为编号,字符串为名称
figsize : 指定figure的宽和高,单位为英寸
dpi : 指定绘图对象的分辨率,即每英寸多少个像素,缺省值为80
facecolor : 背景的颜色
edgecolor : 边框颜色
frameon : 是否显示边框
"""

实例:

1
2
3
4
import matplotlib.pyplot as plt
#创建自定义图像
fig = plt.figure(figsize=(4, 3), facecolor='blue')
plt.show()


2. subplot创建单个子图

2.1. subplot语法

1
2
3
4
5
6
7
8
9
10
suplot(nrows, ncols, sharex, sharey, subplot_kw, **fig_kw)

"""
nrows : subplot的行数
ncols : subplot的列数
sharex : 所有subplot应该使用相同的X轴刻度(调节xlim将会影响所有subplot)
sharey : 所有subplot应该使用相同的Y轴刻度(调节ylim将会影响所有subplot)
subplot_kw : 用于创建各subplot的关键字字典
**fig_kw : 创建figure时的其他关键字,如plt.subplots(2, 2, figsize=(8, 6))
"""

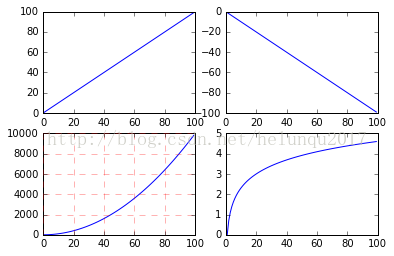
 subplot可以规划figure划分为n个子图,但每条subplot命令只会创建一个子图,参考下面例子:

1
2
3
4
5
6
7
8
9
10
11
12
13
14
15
16
17
18
19
20
21
import numpy as np
import matplotlib.pyplot as plt

x = np.arange(0, 100)
#作图1
plt.subplot(221)
plt.plot(x, x)

#作图2
plt.subplot(222)
plt.plot(x, -x)

#作图3
plt.subplot(223)
plt.plot(x, x ** 2)
plt.grid(color='r', linestyle='--', linewidth=1, alpha=0.3)

#作图4
plt.subplot(224)
plt.plot(x, np.log(x))
plt.show()


3. subplots创建多个子图

3.1. subplots语法

 subplots参数与subplot相似。

实例:

1
2
3
4
5
6
7
8
9
10
11
12
13
14
15
16
17
18
19
20
21
import numpy as np
import matplotlib as plt

x = np.arange(0, 100)
#划分子图
fig, axes = plt.subplots(2, 2)
ax1 = axes[0, 0]
ax2 = axes[0, 1]
ax3 = axes[1, 0]
ax4 = axes[1, 1]

#作图1
ax1.plot(x, x)
#作图2
ax2.plot(x, x)
#作图3
ax3.plot(x, x ** 2)
ax3.grid(color='r', linestyle='--', linewidth=1, alpha=0.3)
#作图4
ax4.plot(x, np.log(x))
plt.show()


4. 面向对象API:add_subplots与add_axes新增子图或区域

 add_subplots与add_axes都是面向对象figure编程的,pyplot api中没有此命令。

4.1. add_subplot新增子图

 add_subplot的参数与subplots的相似。

实例1:

1
2
3
4
5
6
7
8
9
10
11
12
13
import numpy as np
import matplotlib.pyplot as plt

x = np.arange(0, 100)
#新建figure对象
fig = plt.figure()
#新建子图1
ax1 = fig.add_subplot(2, 2, 1)
ax1.plot(x, x)
#新建子图3
ax3 = fig.add_subplot(2, 2, 3)
ax3.plot(x, x ** 2)
ax3.grid(color='r', linestyle='--', linewidth=1, alpha=0.3)


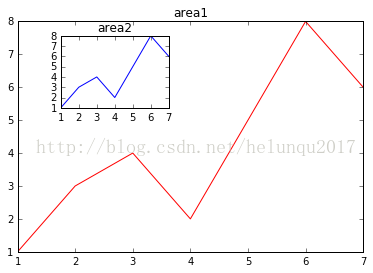
4.2. add_axes新增子区域(图中图)

add_axes为新增子区域,该区域可以坐落在figure内任意位置,且该区域可任意设置大小。

add_axes参数可参考官方文档:add_axes参数

实例:

1
2
3
4
5
6
7
8
9
10
11
12
13
14
15
16
17
18
19
20
21
22
23
24
25
26
import numpy as np
import matplotlib.pyplot as plt

#新建figure对象
fig = plt.figure()

#定义数据
x = [1, 2, 3, 4, 5, 6, 7]
y = [1, 3, 4, 2, 5, 8, 6]

#新建区域ax1
#figure的百分比,从figure 10%的位置开始绘制,宽高是figure的80%
left, bottom, width, height = 0.1, 0.1, 0.8, 0.8
#获得绘制的句柄
ax1 = fig.add_axes([left, bottom, width, height])
ax1.plot(x, y, 'r')
ax1.set_title('area1')


#新增区域ax2,嵌套在ax1内
left, bottom, width, height = 0.2, 0.6, 0.25, 0.25
#获得绘制的句柄
ax2 = fig.add_axes([left, bottom, width, height])
ax2.plot(x, y, 'b')
ax2.set_title('area2')
plt.show()


undefined